Mapping wildfires in R with mapsf
R
spatial
wildfires
Today we will learn how to use the
mapsf package to create incredible maps
1 Introduction
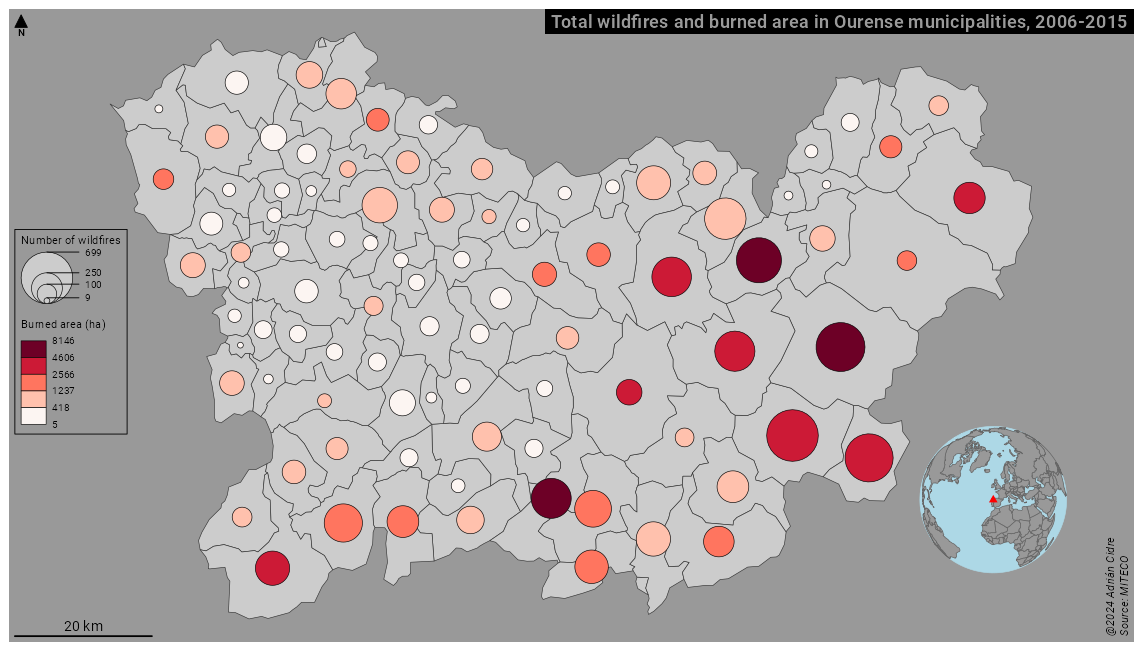
Today we will learn how to use the mapsf R package to create choropleth maps showing the number of wildfires and the burned area combined in the province of Ourense, Spain. By combining two complementary visualization types we can easily identify those areas where both the number of wildfires and the burned areas are very high.
The mapsf package deprecates the well-known cartography package which was around for a while.
2 Code
You can find the code of this tutorial here.
3 Results
At the end of this tutorial, you will be able to create the following map:
You can find all the explanations in the video, and if you like it, don’t forget to hit the like button, subscribe, and share it with others.